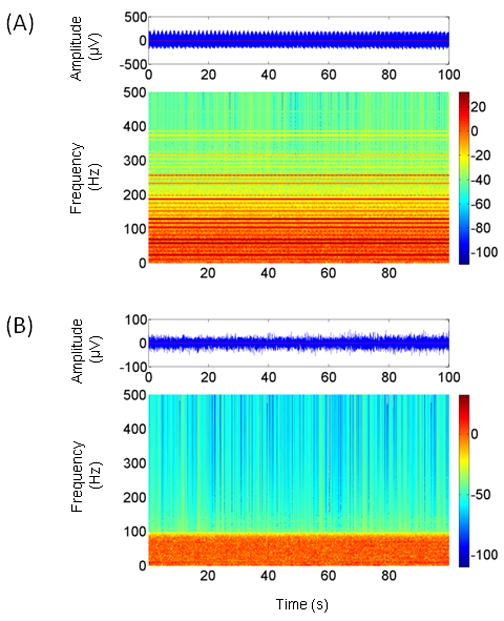
Figure 3.

(A) A 100 s segment of EEG time series contaminated with DBS artifact (top). The spectral components of the artifact are visible in the corresponding time-frequency map. (B) Results of applying the Hampel filter to the EEG time series in Fig. 3A. The time-frequency map shows that the artifact components have been greatly attenuated. Prior to applying the Hampel filter, the data were low-pass filtered with a cut-off frequency of 100 Hz, hence the difference in background activity above this frequency compared to Fig. 3A. The time series in Fig. 3B shows a corresponding reduction in amplitude. Note the different amplitude scales for the EEG time series in (A) and (B).
