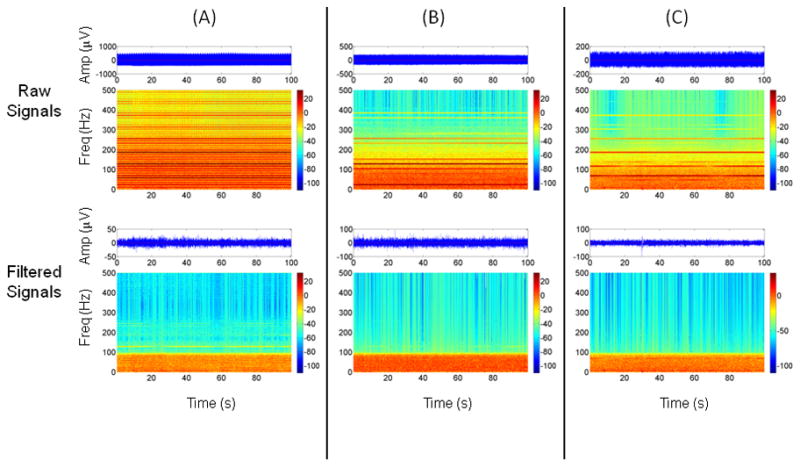
Figure 4.

Spectrograms and time series plots showing the effects of applying the Hampel filter to artifacts from (A) subject #1, (B) subject #3, and (C) subject #4. See Figure 3 for details. Note the different amplitude scales for the EEG time series before and after filtering and between subjects.
