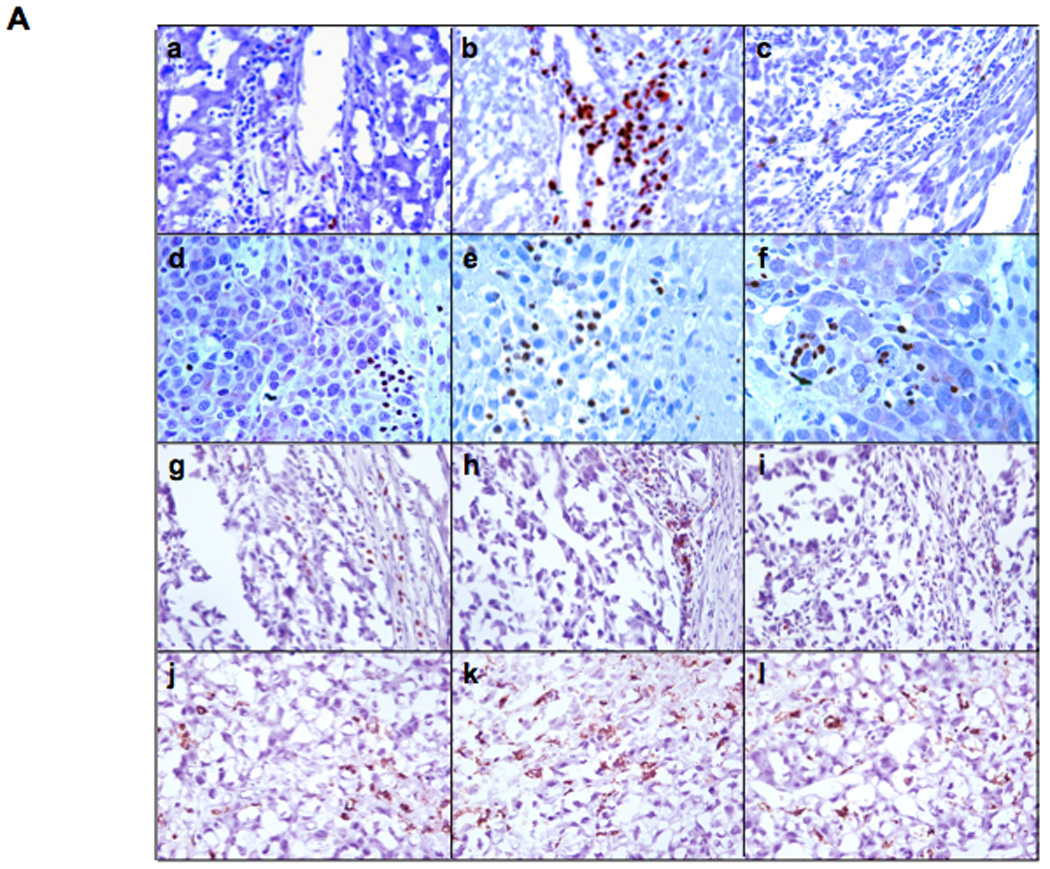
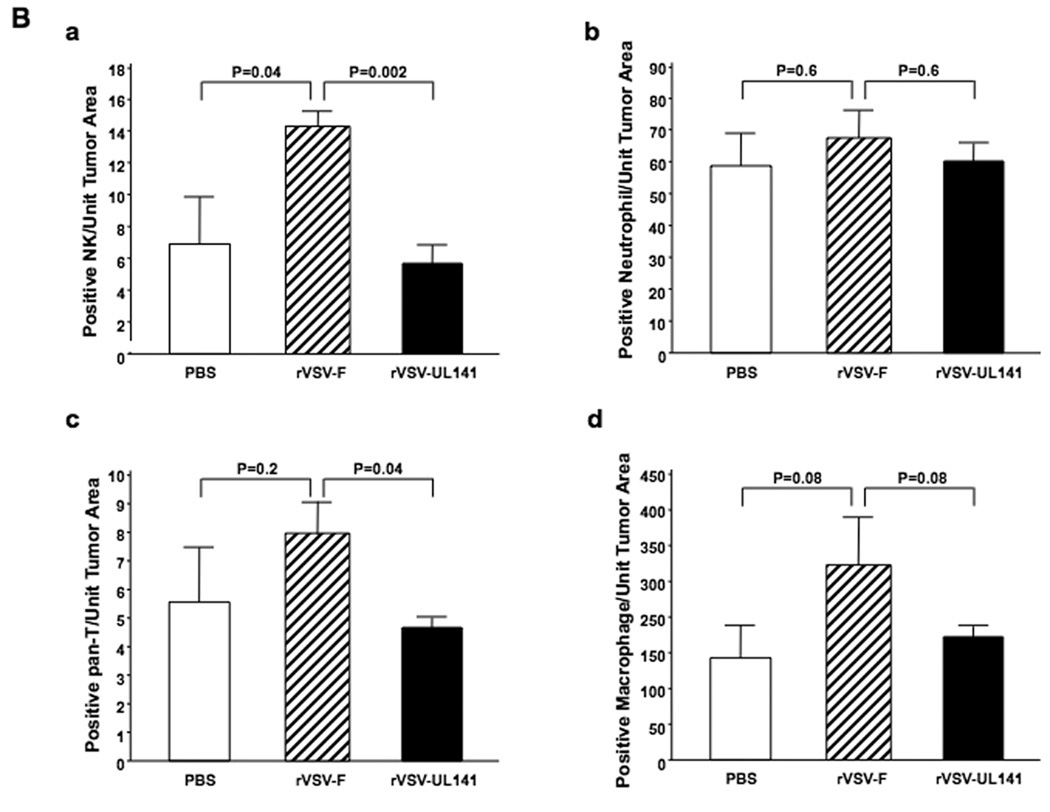
Figure 5. Immunohistochemical staining and semi-quantification of immune cells in tumors.


Panel A, representative immunohistochemical sections from tumors and surrounding tissues. Tumor-bearing rats were infused with PBS (frames a, d, g, j), rVSV-F (frames b, e, h, k) or rVSV-UL141 (frames c, f, i, l) at 1×10⁷ pfu/ml/rat. Samples were obtained from rats at day 3 after virus infusion into the hepatic artery. 5 µm sections were stained with mouse monoclonal anti-NKR-P1A (frames a, b, c), polyclonal anti-myeloperoxidase (frames d, e, f), monoclonal anti-OX-52 (frames g, h, i) and monoclonal anti-ED-1 (frames j, k, l), (magnification=40×). Panel B, semi-quantification of immune cells in the lesions after virus treatment: NK cells (graph a), neutrophils (graph b), pan-T cells (graph c) and macrophages (graph d) by ImagePro software. Immune cell index was calculated as ratio of positive cell to unit tumor area (10,000 pixel as one unit tumor area), and the results were analyzed statistically by two-sided student t-test.
