
Figure 5.
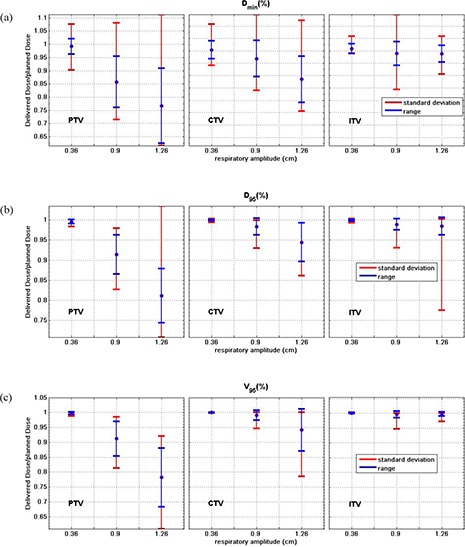
Average , and over 132 simulations of various motion periods and initial phases for moving tumor of all 11 HFRT treatment plans, PTV, CTV and ITV with the standard deviation (blue bars), and range (red bars) of the ratios. The y‐axis scaling does not include the complete range for the largest amplitude PTV results.