
Figure 2. Activation of p90RSK protein in ischemic brain tissues.
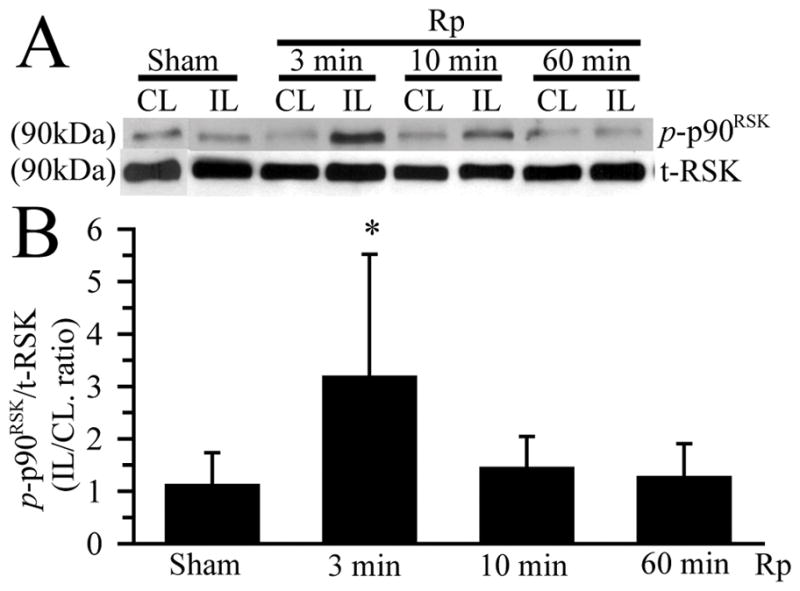
A. Changes of p-p90RSK and non-phospho-p90RSK (t-RSK) expression. CL and IL brain hemisphere samples were prepared as described in Figure 1 legend. The blots were probed with anti-p-p90RSK (Thr359/Ser363) antibody and anti-p90RSK (t-RSK) antibody, respectively. B. Summary data of densitometric analysis. Data are means ± SD (n = 3). * p < 0.05 vs. Sham.