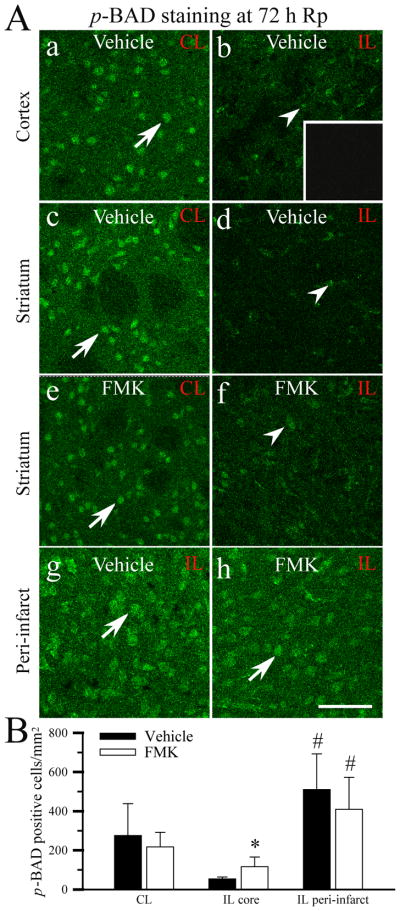
Figure 8. p-BAD expression in ischemic brains.
A. Representative images of p-BAD expression. The specific brain regions were chosen as illustrated in Figure 7. CL: contralateral hemisphere. IL: ipsilateral hemisphere. a – d, g: vehicle-control. e, f, h: FMK-treated. Inset in b: a control study by omitting the primary antibody. Arrow: a basal level of immunoreactive p-BAD staining. Arrowhead: reduced p-BAD immunostaining. Scale bar: 75 μm. B. Summary data. Data are means ± SD (n = 5). * p < 0.05 vs. CL. # p < 0.05 vs. the ischemic core area.

