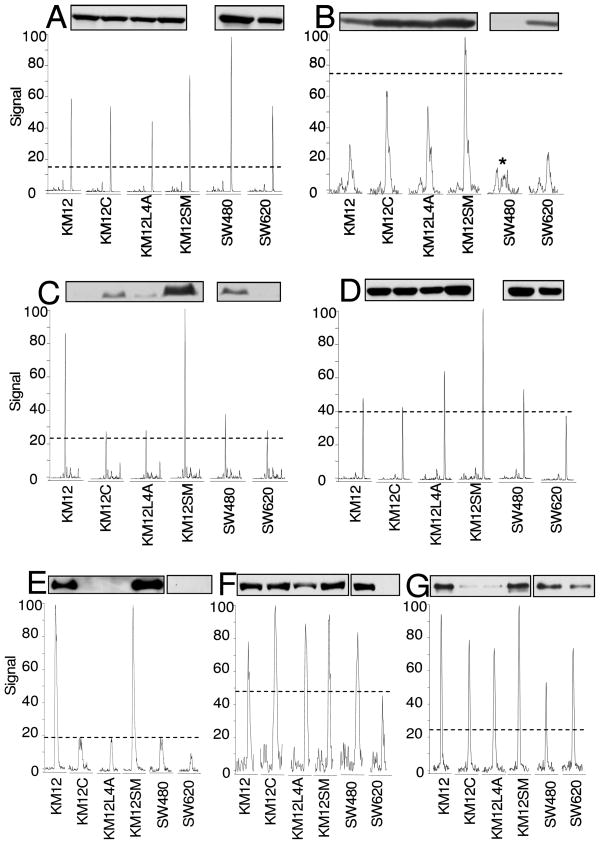
Figure 2. Comparison of Protein Expression Measured by Western Blot and LC-MRM.
Western blot and extracted ion chromatograms from LC-MRM quantification of protein expression in colon cancer cell lines KM12, KM12C, KM12L4A, KM12SM, SW480, SW620 are shown for (A) EGLLAIFK from β-catenin (15–45 min), (B) LLLNAENPR from c-Src (22–27 min), (C) DQIPELENNEK from c-Myc (15–35 min), (D) YSFLQFDPAPR from PP2A Catalytic subunit (20–40 min), (E) FAGVFHVEK from CD44 (23–28 min), (F) SDALNSAIDK from α-catenin (20–23.2 min), and (G) ANFENLAK from Cortactin (21–26 min). Dashed lines show the signal intensity from internal standards (see Table 1) which are used for normalization. The asterisk indicates the correct peak from SW480, which was verified by fragment ion signal ratios in the composite tandem mass spectrum.

