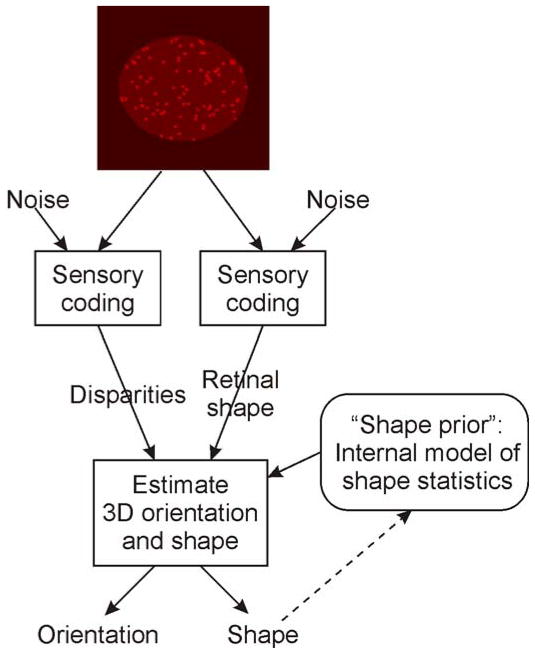
Figure 8.
Schematic diagram of an adaptive Bayesian model. The estimator relies on an internal model of shape statistics to interpret the retinal figure shape information. By combining noisy sensory information provided by disparities and retinal figure shape with prior knowledge of shape statistics, the estimator derives a probability distribution on the likely orientations and shapes that gave rise to the sensory data. In the model described in the text, the derived information about shape is used to update the internal model of the current statistics of shapes in the environment (dashed arrow).

