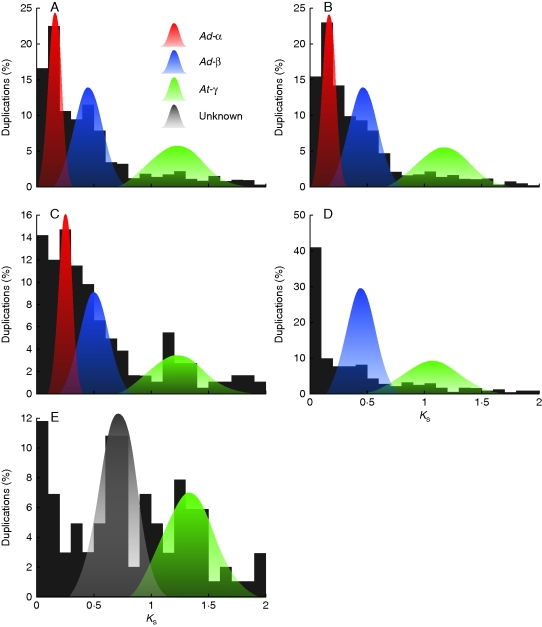
Fig. 1.
Histograms of the age distribution of gene duplications from (A) Actinidia chinensis, (B) Actinidia deliciosa, (C) Actinidia eriantha, (D) Camellia sinensis and (E) Diospyros kaki. Shaded distributions represent mixture model fits of inferred whole genome duplications: red = Ad-α, blue = Ad-β, green = putative At-γ, and grey = possible duplication.

