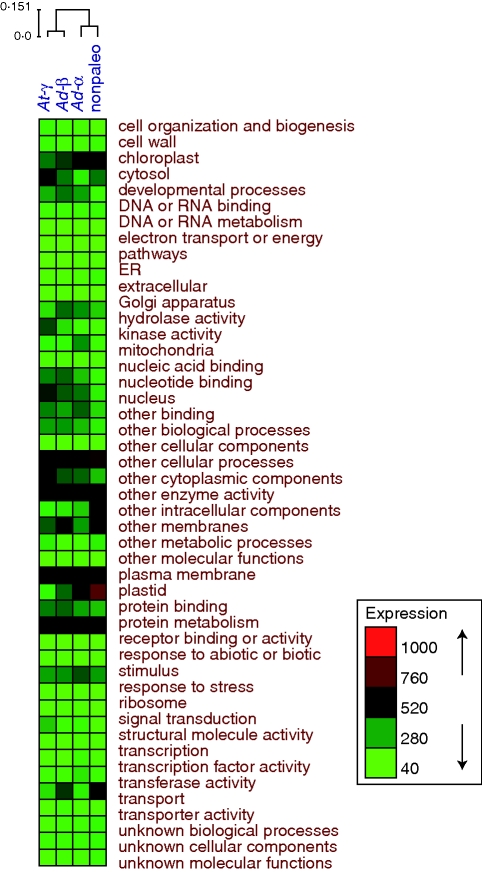
Fig. 3.
GO annotations of Actinidia non-paleologues and paleologues. The colour enrichment represents the normalized unigene number of each GO slim category in the pooled Actinidia non-paleologues and paleologues. The GO slim category patterns among non-paleologues and paleologues were revealed by complete linkage hierarchical clustering. Boxes reflect relative level of GO category representation from low (green) to high (red).

