
Figure 6.
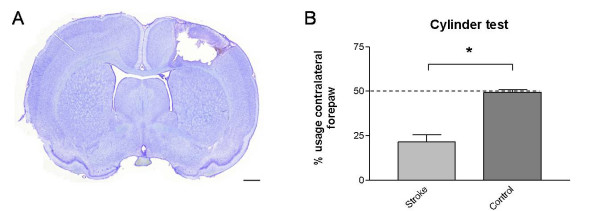
Photothrombotic stroke model. (A) Shows a representative cresylviolet staining of the photothrombotic stroke region. The limb use asymmetry test (B) showed a significant deficit in the usage of the forepaws contralateral to lesion site of stroke animals in comparison to the sham animals. Data are shown as mean ± s.e.m. * p = 0.029. Scale bar, 1 mm.