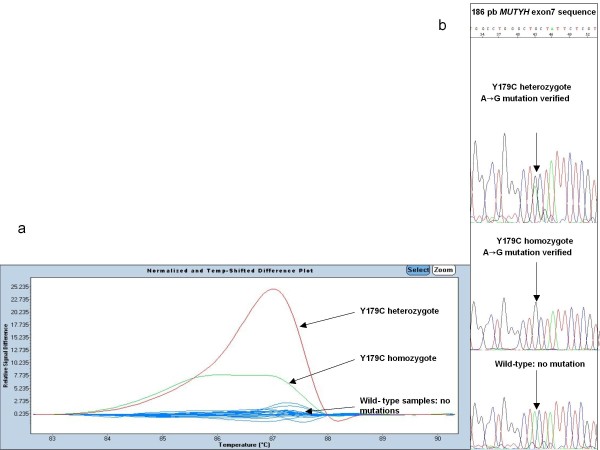
Figure 1.
Different plot and sequence traces for MUTYH exon 7 mutations. (a) The melting profile with sensitivity 0,3. The figure shows that mutations were clearly distinct from the wild type controls. Melt curves of each mutation (red: Y176C heterozygote, green: Y179C homozygote were plotted against the wild types (blue). (b) Sequencing electropherograms show a Y179C heterozygous mutation, a Y179C homozygous mutation and a wild type.

