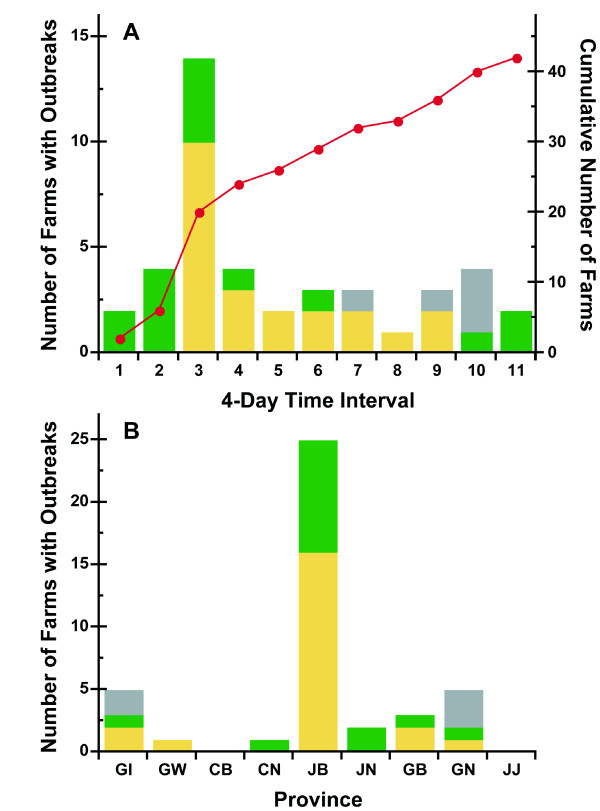
Figure 2.
A, The number of AI outbreaks in the poultry farms is shown after the first outbreak in South Korea 2008. Yellow bars represent the number of outbreaks by chickens and Green bars represent the number of outbreaks by ducks. The line represents the cumulative number of AI outbreaks in poultry farms based on the outbreak reports by Ministry for Food, Agriculture, Forestry and Fisheries in South Korea 2008 in which the authorities instituted a quarantine in the area. B, The number of outbreaks on poultry farms is shown by the provinces in South Korea 2008. Green, yellow and gray bars represent the number of AI outbreaks of chicken, duck, and chicken-duck poultry farms.

