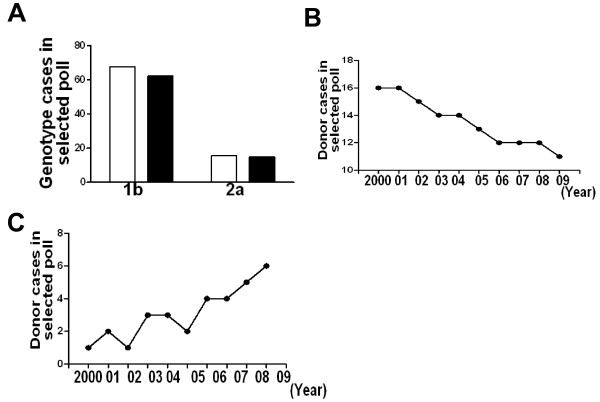
Figure 3.
Genotype distribution and switch in donors and patients. Blood sample form 200 represented donors and 100 patients were genotyped. Then genotype 1b and 2a cases were counted. After that, rate of 1b and 2a cases were distributed in different years. A, genotype 1b and 2a comparison in donors (blank) and patients (black); B, genotype 1b distribution from the year of 2000 to 2009; C genotype 2a distribution from the year of 2000 to 2009.

