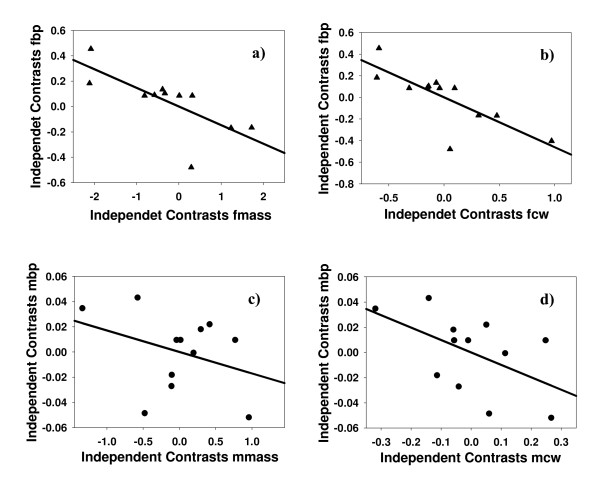
Figure 5.
Relationship between body size and bridging propensity. Plots show the relationship between either body mass (mass) or carapace width (CW) and bridging propensity (bp) for both sexes. a) female bp (fbp) vs. body mass (fmass); b) female bp (fbp) vs. female CW (fcw), c) male bp (mbp) vs. male body mass (mmass) d) male bp (mbp) vs. male carapace width (mcw). All variables were log-transformed (see text for more details). Points are independent contrasts.

