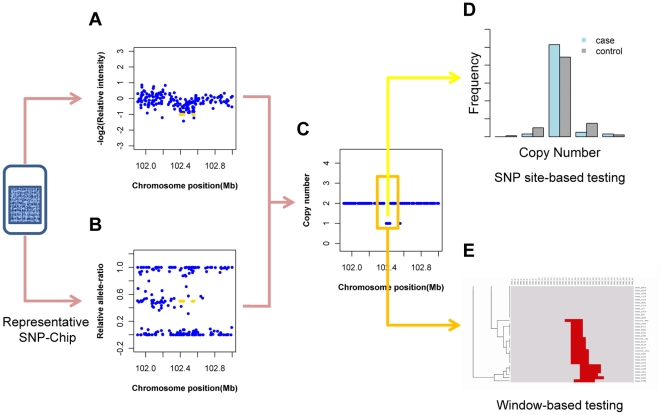
Figure 1. CNV-association strategy transforms raw signal into copy number and detects association through site-specific testing and CNV-pattern clustering.
(A) Relative intensity was log2-transformed value for the normalized intensity-sum of the SNP alleles. (B) the relative allele-ratio was actually a normalized anti-tangent value for the intensity ratio of SNP alleles. These two measurements were arranged along the chromosomal sequence as a hidden Markov model. (C) In this model (with well-trained parameters), the copy number could be calculated from the measurements on each SNP site and the neighboring copy numbers. (D) The copy numbers of a designated site for cases and controls were classified before performing the SNP site-based testing, a Chi-squared test with triple NULL hypotheses in which deletion (labeled as Loss), amplification (labeled as Gain) or both (labeled as Abnm) were viewed as abnormal. Copy numbers in a window centered to the significant SNP site (denoted in the orange box) were subjected to a complete linkage clustering (E). To this clustering heat map, a statistical test on the CNV-pattern (named as window-based testing) was used to reconfirm the significance of association. (See details in the Materials and Methods .)

