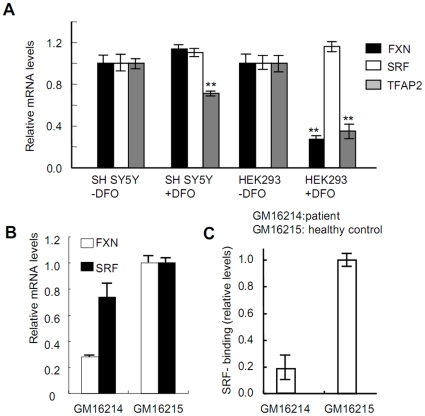
Figure 4. Cellular iron depletion decreases frataxin expression.
(A) Iron depletion decreases frataxin and TFAP2 mRNA levels in tested cells. qRT-PCR was performed to quantify the mRNA levels of frataxin, SRF, and TFAP2 in SHSY5Y and HEK293 cells following treatment with 30 µM DFO for 48 hours. GAPDH was used as an internal control. Three separate experiments were carried out. For each experiment, duplicate iron treatment was performed. The error bars represent standard deviation. Statistical analysis was performed using the Student's t-test: **: ρ<0.001. (B) mRNA levels of SRF and frataxin in lymphoblasts derived from patient (GM16214) and healthy control (GM16215). qRT-PCR was performed to quantify the mRNA levels of frataxin and SRF with the total RNA isolated from patient and control. (C) Binding of SRF to the FXN promoter is dramatically decreased in patient lymphoblasts. ChIP assays were conducted as described in Figure 1. The relative expression level in the patient cells is normalized to the healthy control cells, which are set at 1.

