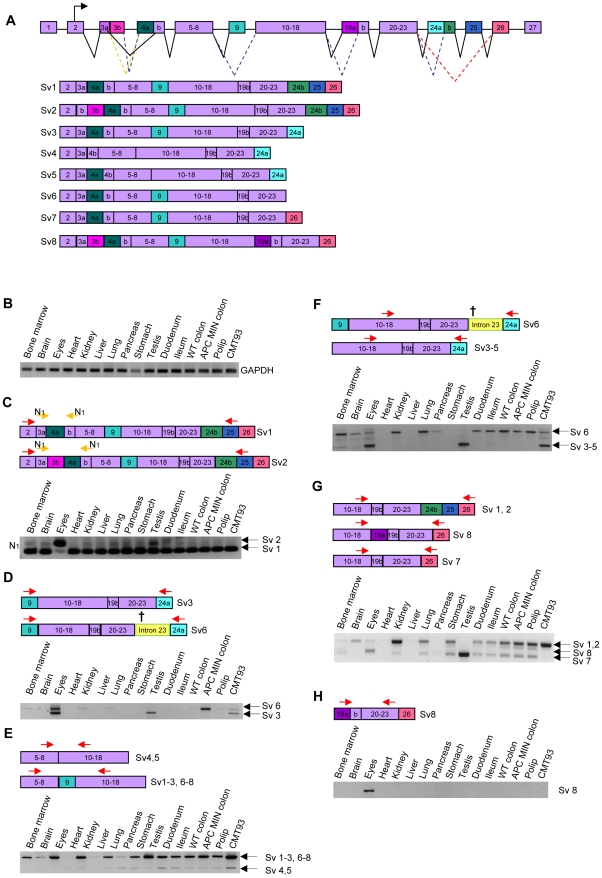
Figure 2. Expression of prominin-1 splice variants in mouse organs.
A. Schematic representation of prominin-1 splicing. Differentially spliced exons are indicated by distinct colors. B. PCR performed on mouse tissues with primers amplifying GAPDH to confirm mRNA expression C–H PCR data representing prominin-1 SV expression in mouse tissues. Each subpanel contains the analysed SVs, the location were the primers bind (arrows) and the acquired products after performing the PCR. Primers sequences can be found in Table 3. C. PCR to specifically detect SV1 and SV2 with primers amplifying exon 2 to 25, only SV1 and SV2 products were obtained. Additionally, a nested PCR amplifying regions specific for SV1 and SV2 was performed. N1 and N2 stand for nested primer sets. D. SV3 was discriminated from the other SVs by amplifying the region from exon 9 to exon 24a. E. SV4 and SV5 were analysed together due to only a minor difference between these SVs (15 bp). By amplifying exon 8 to exon 11, SV4 and SV5 were discriminated from the other SVs. F. To specifically detect SV6, primers amplifying exon 18 to exon 24a were used, making use of the fact that SV6 retains intron 23. G. SV7 and SV8 were discriminated from the other SVs by amplifying exon 18 to exon 26. H. The expression pattern of SV8 was analyzed by using primers that bind the exon 19a, which is specifically expressed in SV8.

