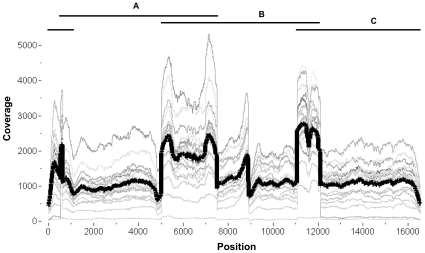
Figure 1. Variability in 454 sequence coverage.
Total read coverage (redundant and non-redundant) is plotted at each mtDNA position (1 to 16569) and graphed as a continuous thin gray trace for each case (different shades for each case). The mean coverage for all 20 cases is represented by a thick dark black trace. The shape of the traces shows coverage variability both between cases and along the same mtDNA. The black horizontal lines (A, B & C) above the graph represent the three mtDNA PCR fragments used for 454 sequencing. Greater coverage was noted in the regions in which the PCR fragments overlap compared to coverage in non-overlapping regions.

