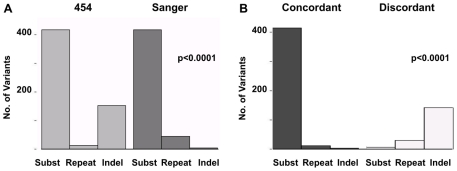
Figure 2. Comparison of 454 and Sanger sequencing results.
Histograms show the distribution of variants by type: single nucleotide substitutions (subst), repeats and insertion/deletions (indel). A. Sequencing method. Results are separated by detection using 454 (left panel, light gray) or Sanger (right panel, dark gray). B. Concordance. Results are separated by concordant detection using 454 and Sanger sequencing (left panel, dark gray) or by discordant detection, 454 or Sanger sequencing only (right panel, light gray). We observed high concordance between the two methods for mtDNA substitutions and significant discordance for indels.

