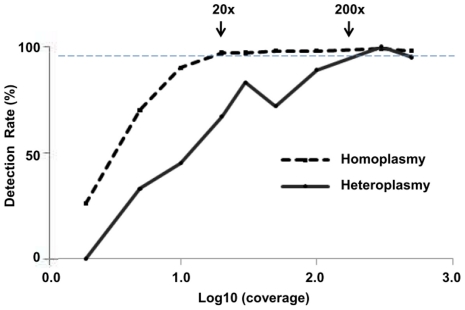
Figure 4. Coverage simulations and variant detection rate for mtDNA variants.
By subsampling all mapped 454 reads, we simulated nine levels of coverage (2× to 500×) for 419 mtDNA substitution variants. Graph shows the variant detection rate by the log10 (coverage) for homoplasmy (black solid line, n = 413) and heteroplasmy (black dashed line, n = 6). We estimated that the minimum coverages to detect 95% of the variants (gray dashed horizontal line) are >20× for homoplasmy and >200× for heteroplasmy.

