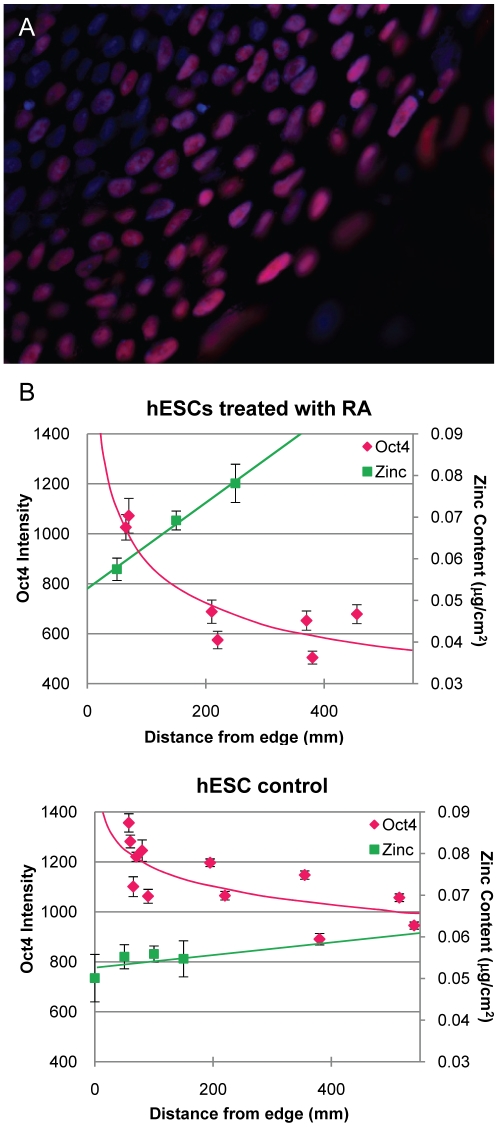
Figure 2. RA induced differentiation correlates with increased nuclear zinc content at the center of hESC colonies.
A. Oct4 (pink) lost at center of hESC colonies treated with RA. Cells are counterstained with Hoechst (blue). B. Graphs depict quantified Oct4 intensity vs. total zinc content from XRF of control (i) and RA treated (ii) hESCs across a typical colony. Results are plotted as mean ± SEM.

