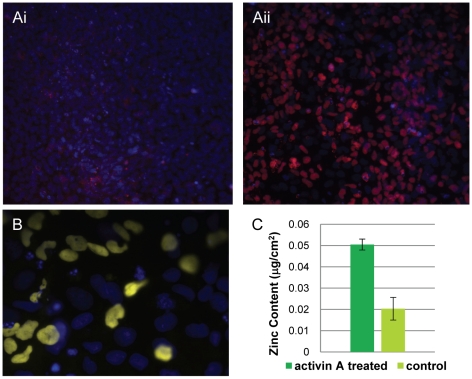
Figure 3. Activin A induced differentiated hESCs have increased zinc content.
A. Control (i) and Activin A treated (ii) hESCs stained with Oct 4 (pink) and counterstained with Hoechst (blue). B. Sox17 expression (yellow) in Activin A treated cells. Cells are counterstained with Hoechst (blue). C. Graph depicting zinc content of Activin A treated cells vs. control. Results are graphed as mean ± SEM.

