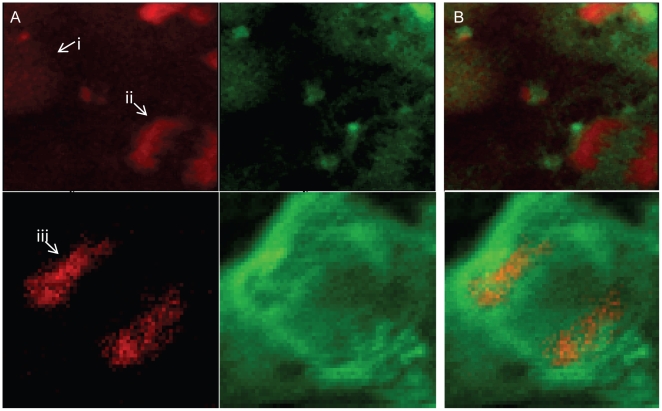
Figure 5. Zinc excluded from condensed chromosomes of mitotic cell.
A. Raster scans mapping Kα line fluorescence of phosphorus (red) and zinc (green) of an interphase (i) and mitotic (ii, iii) cells. B. Overlay demonstrating overlap of zinc and phosphorus in the interphase cell and mutual exclusion in the anaphase cells. The first row of images was obtained with x-ray beam spot size of 0.4×0.3 um with step sizes of 0.2 um. Second row was obtained with 0.6×0.8 um spot size and a 0.5 um step size.

