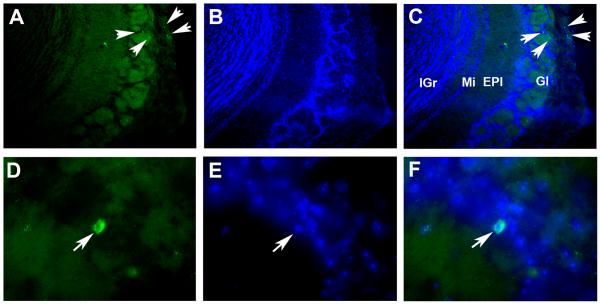
FIGURE 8.
Digital images at 100 times magnification (A, B, C) or 400 times magnification (D, E, F) of FITC immunofluorescent signals corresponding to CD3 positive cells (A, D) in the olfactory bulbs of mice sensitized and challenged with albumin from chicken egg (OVA). Images obtained from Hoechst staining (B, E) were merged with those of CD3 to confirm co-localization of the CD3 signal with nuclear DNA (C, F). Arrows indicate some identified CD3 positive cells in the glomerular cell layer (Gl). EPl: external plexiform cell layer; Mi: mitral cell layer; IGr: internal granular cell layer.

