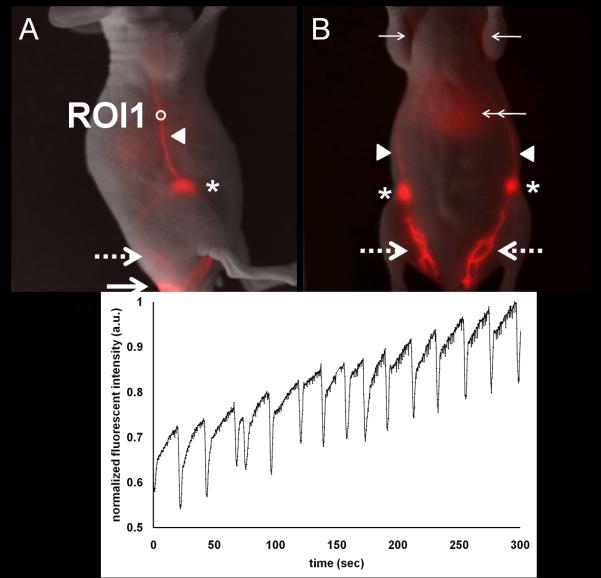
Figure 2.
Normal lymphatic drainage pathways and function in a tumor-free mouse. Overlay of white light and fluorescent images in the right lateral view (A) and the ventral view (B) of a normal mouse showing lymphatic trafficking of ICG-labeled lymph from the injection site (large arrow), through the lymphatic plexus (large broken arrow), to the inguinal LN (asterisk) and subsequently to the axillary LN (small arrow) via the internodal collecting lymphatic vessels (arrow head). (C) Normalized fluorescent intensity as a function of time in ROI 1 selected in a fluorescent internodal collecting lymphatic vessel as shown in Figure 2B illustrates contractile activity and propelled lymph flow. Supplemental Figure 1 shows non-overlaid, pseudo colored fluorescence imaging of (B) showing more clearly the axillary lymph nodes.

