Fig. 3.
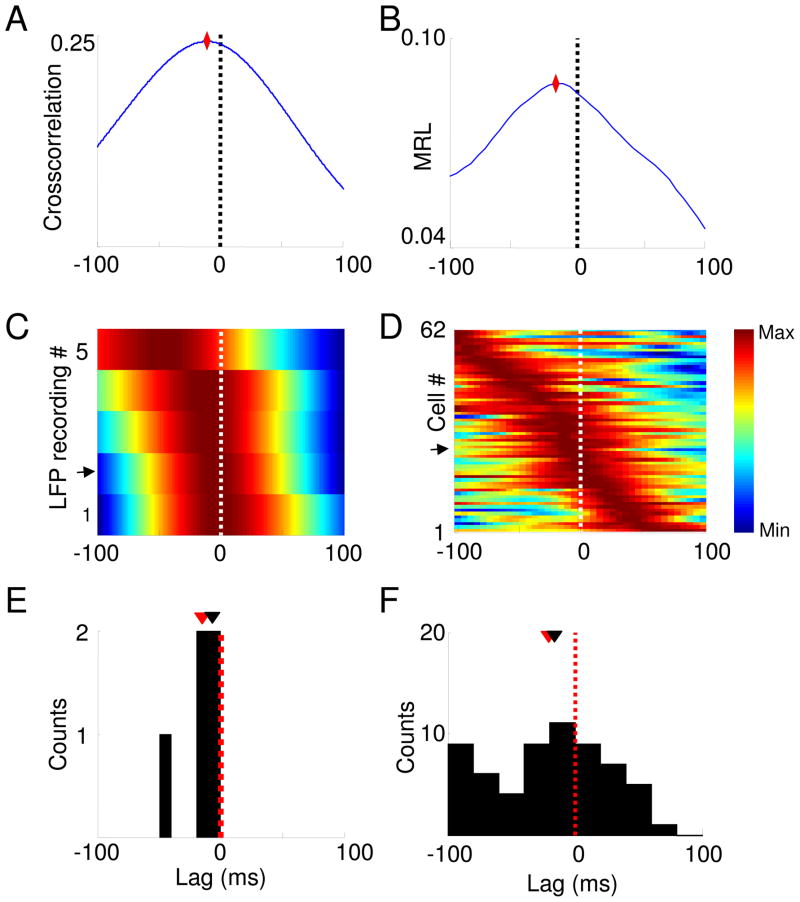
Estimation of lags between dHPC and mPFC using the amplitude cross-correlation and phase locking methods. (A) dHPC-mPFC lag estimated from a single recording session by crosscorrelating the amplitudes of theta-filtered traces. Note that the peak occurs at a negative lag, indicating that the dHPC leads the mPFC in the theta range. (B) Effect of shifting an mPFC spike train from a single unit on the strength of phase-locking (MRL). The plot shows that this mPFC single unit phase locks best to dHPC theta of the past, in agreement with the directionality shown in (A). Diamonds denote the peaks in both (A) and (B). (C) Normalized color plots of amplitude cross-correlations from 5 recordings and phase-locking shifts from 62 mPFC single units (D). Warmer colors indicate higher cross-correlation peaks or greater phase-locking strength. Each row corresponds to a single LFP (C) or single unit (D) recording. Rows are arranged according to the peak lag. Arrows mark the rows representing the data shown in the upper panels. (E, F) Histograms showing the distribution of peak lags calculated with each method. The distribution of lags is significantly negative for both the amplitude cross-correlation (E) (p<0.05, Wilcoxon rank-sum test, mean lag −15.4 ± 7.9 ms, n=5 recordings) and phase-locking method (F) (p<0.003 for a paired Wilcoxon’s rank sum test, mean lag −20.2 ± 5.8 ms, n=30 recordings). Means and medians of the lag distributions are indicated, respectively, by black and red arrowheads.

