Fig. 6.
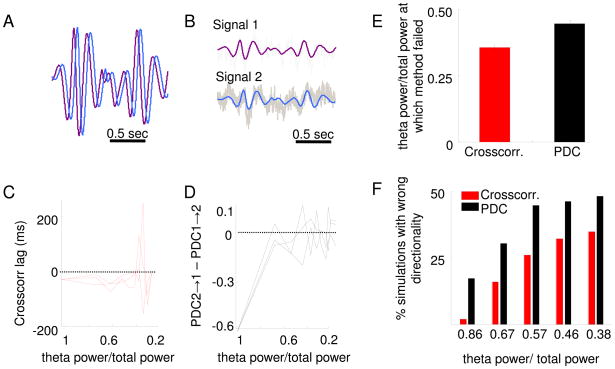
Partial directed coherence is more sensitive to noise than the amplitude cross-correlation method. (A) Two signals were created from the same two-second segment of vHPC theta-filtered trace. One signal was shifted relative to the other by 28 ms (this is the mean delay between the vHPC and the mPFC calculated by the amplitude cross-correlation method). Thus, the purple trace leads the blue trace with a lag of 28 ms. (B) Pink noise was generated randomly and added to both signals. Ten different levels of noise were added, such the fraction of theta power relative to total power in the signals after adding noise was varied from 1 to 0.2. In the example shown, theta power/total power=0.67. (C)The amplitude cross-correlation method was applied to verify the directionality after adding pink noise to both signals, in 500 simulations in which noise was newly generated, at 10 different amplitudes. Calculation of the lag by the cross-correlation method for three representative simulations is shown. Points with negative lags have the expected directionality. The cross-correlation method fails only when high levels of noise are added, as shown by the points with positive lags with low theta power to total power ratios. Note that the x axis is reversed, such that higher values (high signal to noise ratios) are on the left. (D) Same as in (C), but for PDC calculated from the identical simulations. Correct directionality is reflected as negative values on the y axis. PDC1→2 indicates PDC in the purple trace in A causing the blue trace. Note that this method does not consistently indicate that the purple trace leads the blue trace even after adding only moderate amounts of noise to the signal. (E) Mean noise level at which each method first failed, averaged across 500 simulations. The PDC method on average fails at lower noise levels than the amplitude cross-correlation method (p<0.0001, ranksum test). (F) For five noise levels, the percentage of simulations in which the wrong directionality was calculated is shown. At every noise level PDC had a significantly higher failure rate than the amplitude cross-correlation method (p<0.05, Fisher’s exact test). All PDC values shown are averages across the theta-range.

