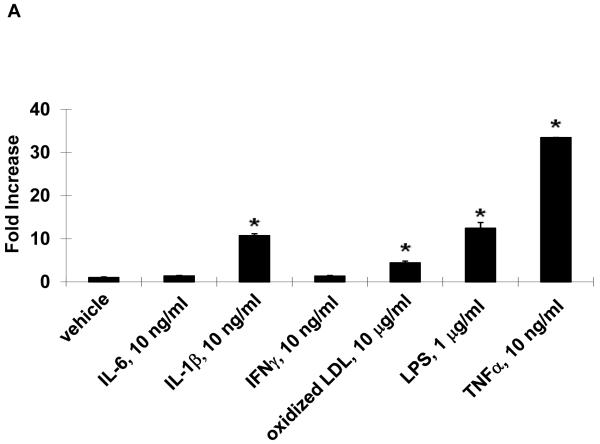
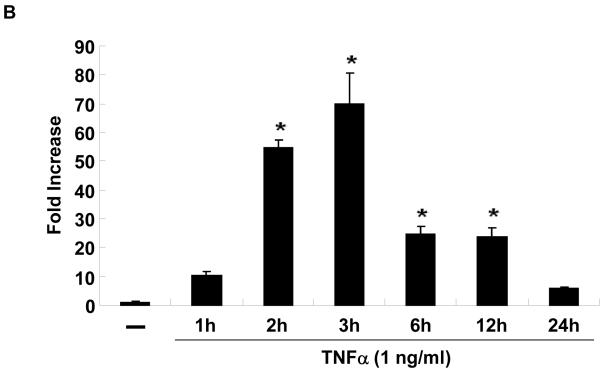
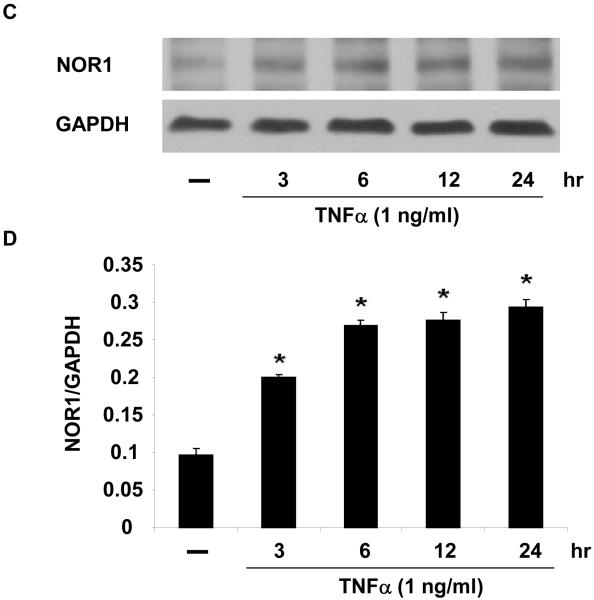
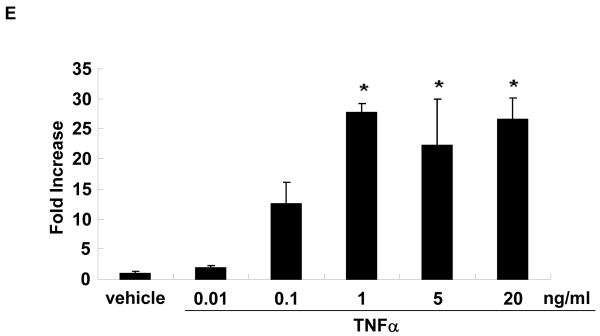
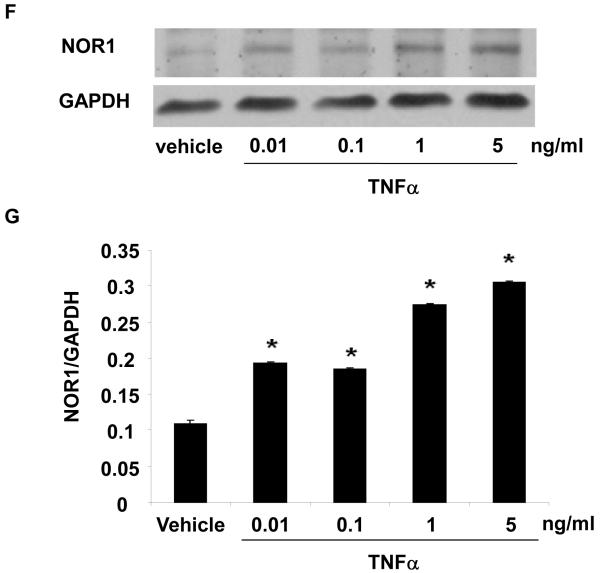
Figure 2. NOR1 is induced by inflammatory stimuli in endothelial cells.
(A) HUVEC were stimulated as indicated for 2 hours and NOR1 mRNA expression was analyzed. (B-D) HUVEC were stimulated with TNF⟨ (1 ng/ml) and NOR1 mRNA (B) and protein expression (C) were analyzed at the indicated time points. (D) Densitometric analysis of NOR1 protein expression in (C). (E-G) HUVEC were stimulated with vehicle (PBS) or the indicated dose of TNF⟨. NOR1 mRNA (E) and protein (F) expression were analyzed after 2 hours or 6 hours, respectively. (G) Densitometric analysis of NOR1 protein expression in (F). NOR1 mRNA expression levels were normalized to hTBP and presented as mean ± SEM fold increase over vehicle-treated cells (*P < 0.05 vs. vehicle). Densitometric analysis was performed on three independent experiments. Cohybridization for GAPDH was performed to assess equal loading.

