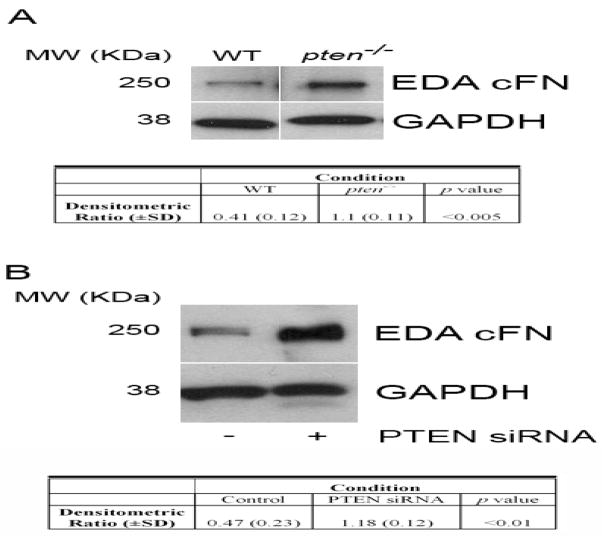
Figure 2. Enhanced EDA cFN protein production following loss or downregulation of PTEN.
(A) Western blot analysis of EDA cFN protein level in serum-starved pten−/− vs. WT cells. Blots were stripped and re-probed for GAPDH as a loading control. Western blot experiments were performed 3 times. MW (KDa) refers to the molecular weight of the identified protein in KDa. Table reflects densitometric ratio (± SD) of EDA cFN to GAPDH in repeated samples. The difference is statistically significant (P<0.005). (B) PTEN knockdown in normal lung fibroblasts enhances EDA cFN protein level. IMR-90 cells were transiently transfected with PTEN siRNA or scrambled control construct for 24 hours, and protein lysates were assessed by Western blot for EDA cFN. GAPDH was assessed as a loading control. MW (KDa) refers to the molecular weight of the identified protein in KDa. Table reflects densitometric ratio (± SD) of EDA cFN to GAPDH in repeated samples. The difference is statistically significant (P<0.01). The blot is representative of 3 independently-performed experiments.

