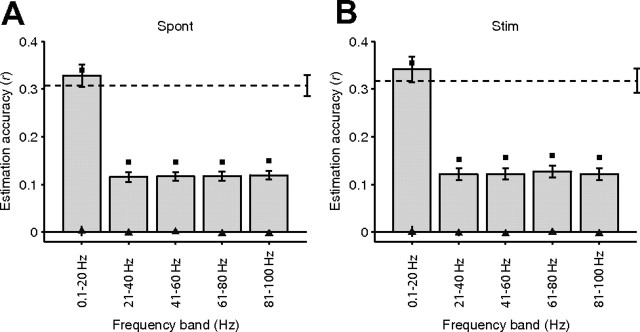
Figure 5.
Frequency dependence. Mean estimation accuracies for five different frequency bands between 0.1 and 100 Hz for all V1 trials during spontaneous activity (A, n = 88) and visual stimulation (B, n = 71). We filtered the LFPs in the corresponding frequency band, we computed the W–K filters, and we estimated the LFPs by convolving the electrode-specific filters with each spike train (see Results, Toward a general function to map spikes into LFPs). The horizontal dashed lines represent the mean estimation accuracy for the unfiltered LFPs (see Fig. 3B). The conventions are the same as in Figure 3. Error bars denote 1 SEM. The black squares correspond to the reconstruction accuracies, and the triangles indicate the chance performance levels. The LFP estimations are significantly better than the ones obtained under the null hypothesis (triangles) at all frequency bands (p < 0.01, based on a two-sample Kolmogorov–Smirnov test), and the 0.1–20 Hz frequency band yielded significantly higher estimation accuracies than all other frequency bands (p < 0.01, based on a two-sample Kolmogorov–Smirnov test).

