
Fig. 2.
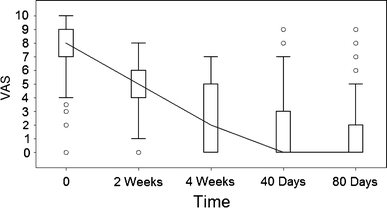
Change of VAS during GTN treatment. Line represent the mean VAS score, boxes represent standard deviation and 95% confidence intervals. Circles represent single values outside the 95% confidence interval
Official websites use .gov
A
.gov website belongs to an official
government organization in the United States.
Secure .gov websites use HTTPS
A lock (
) or https:// means you've safely
connected to the .gov website. Share sensitive
information only on official, secure websites.
Change of VAS during GTN treatment. Line represent the mean VAS score, boxes represent standard deviation and 95% confidence intervals. Circles represent single values outside the 95% confidence interval