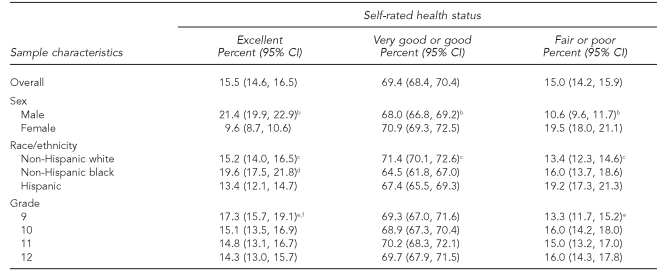
Table 1.
Prevalence of self-rated health status overall and by sex, race/ethnicity,a and grade: U.S. Youth Risk Behavior Survey, 2007
aData for American Indian/Alaska Native, Asian, Native Hawaiian or other Pacific Islander, and multiple race (non-Hispanic) not shown due to small numbers of students in these subgroups.
bStatistically significant at p<0.05 for differences by sex
cStatistically significant at p<0.05 for the following differences by race/ethnicity: non-Hispanic white vs. non-Hispanic black; non-Hispanic white vs. Hispanic
dStatistically significant at p<0.05 for the following differences by race/ethnicity: non-Hispanic black vs. Hispanic
eStatistically significant at p<0.05 for the following differences by grade: ninth vs. 10th grade
fStatistically significant at p<0.05 for the following differences by grade: ninth vs. 12th grade
CI = confidence interval

