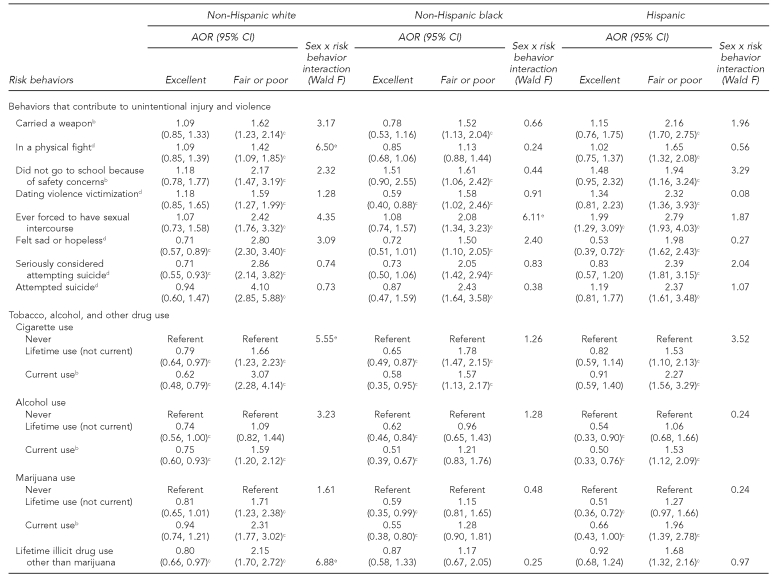
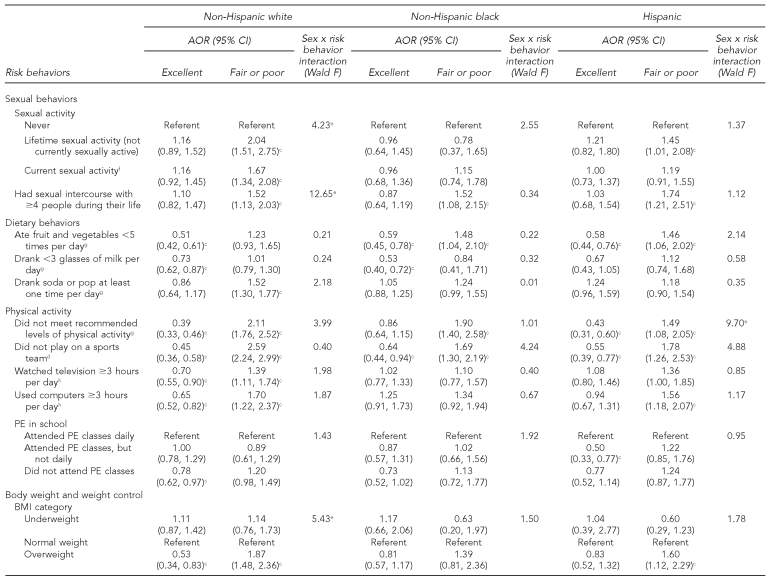
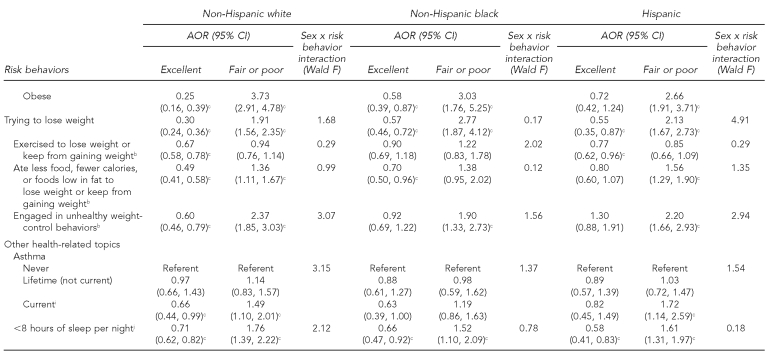
Table 2.
Adjusted odds ratios and 95% CIs for excellent and fair or poor self-rated health status by race/ethnicity:a U.S. Youth Risk Behavior Survey, 2007
aModels adjusted for sex and grade. Referent category is very good or good self-rated health status.
bDuring the 30 days before the survey
cAOR statistically significant at p<0.05
dDuring the 12 months before the survey
eSex × risk behavior interaction term statistically significant at p<0.01
fDuring the three months before the survey
gDuring the seven days before the survey
hOn an average school day
iEver told by a doctor or nurse that they had asthma and still have asthma
jOn an average school night
CI = confidence interval
AOR = adjusted odds ratio
PE = physical education
BMI = body mass index


