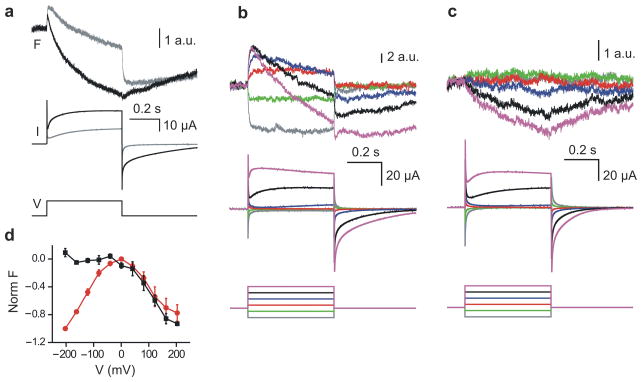
Figure 5.
Hv1 voltage-sensor coupling detected by voltage-clamp fluorometry. (a) Voltage sensor movement detected on Hv1 195C labeled with TAMRA-MTS. Changes in fluorescence (F) and proton current (I) were produced by the indicated voltage step (V) from −80 mV to +160 mV. Traces in gray were recorded at pHo 7.4. Traces in black were recorded from the same oocyte in acetate buffer at pHo 6.3, which also acidifies the internal solution (see text). (b–c) Comparison between voltage sensor movement in labeled 195C/195C homodimers and 195C/218S heterodimers. Heterodimers were produced by co-expressing the Hv1 195C subunit with an excess of the 218S subunit. Fluorescence changes and proton currents were elicited by voltage steps from −200 to +200 mV in 80 mV increments. Holding potential was −80 mV, pHo was 6.3. (d) Normalized F-Vs from labeled oocytes expressing the Hv1 195C subunit (red circles) or co-expressing the 195C and 218S subunits (black squares). Fluorescence was measured at the end of the 500-ms long test-pulse (voltage protocol and recording conditions as in b–c. Each point is the average of 5 measurements ± s.e.m.

