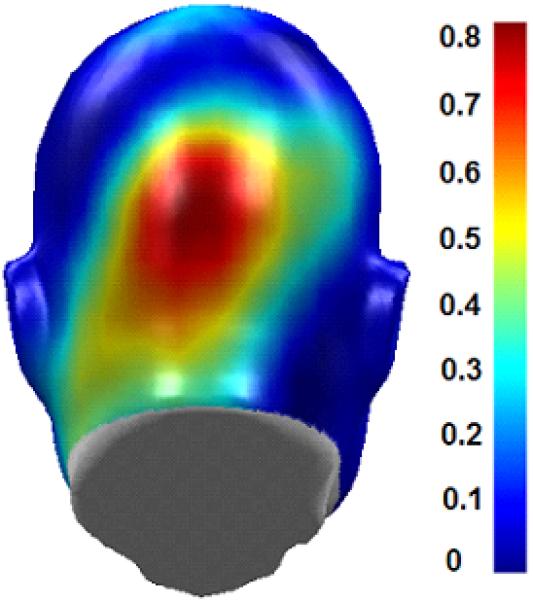
Figure 2.

Head surface map (looking at the back of the head) of evoked visual response power to the steady-state stimuli (averaged over both frequencies and conditions). For display purposes, brain responses to the 12-and 15-Hz stimuli were placed on the same scale (maximum of 1) to adjust for between-frequency ssVEP power differences.
