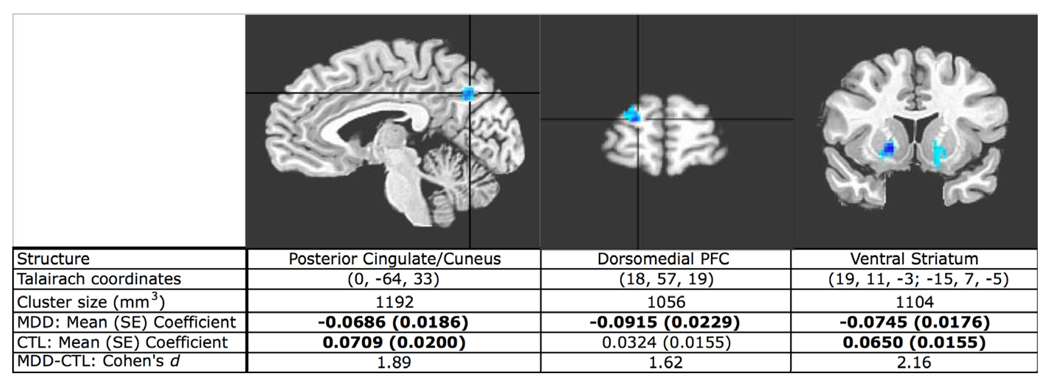
Figure 4.
T-statistic map of MDD-versus-control comparison of whole brain-to-vACC GC analysis fit coefficients. Increased activity in the vACC predicts subsequent decreases in activity in the PCC, DMPFC and ventral striatum, bilaterally more in MDD than in control participants. Group mean coefficients are averaged from suprathreshold cluster, ventral striatum clusters averaged together. Group means in bold are significantly different from zero (two-tailed test, all ps < .01, uncorrected).

