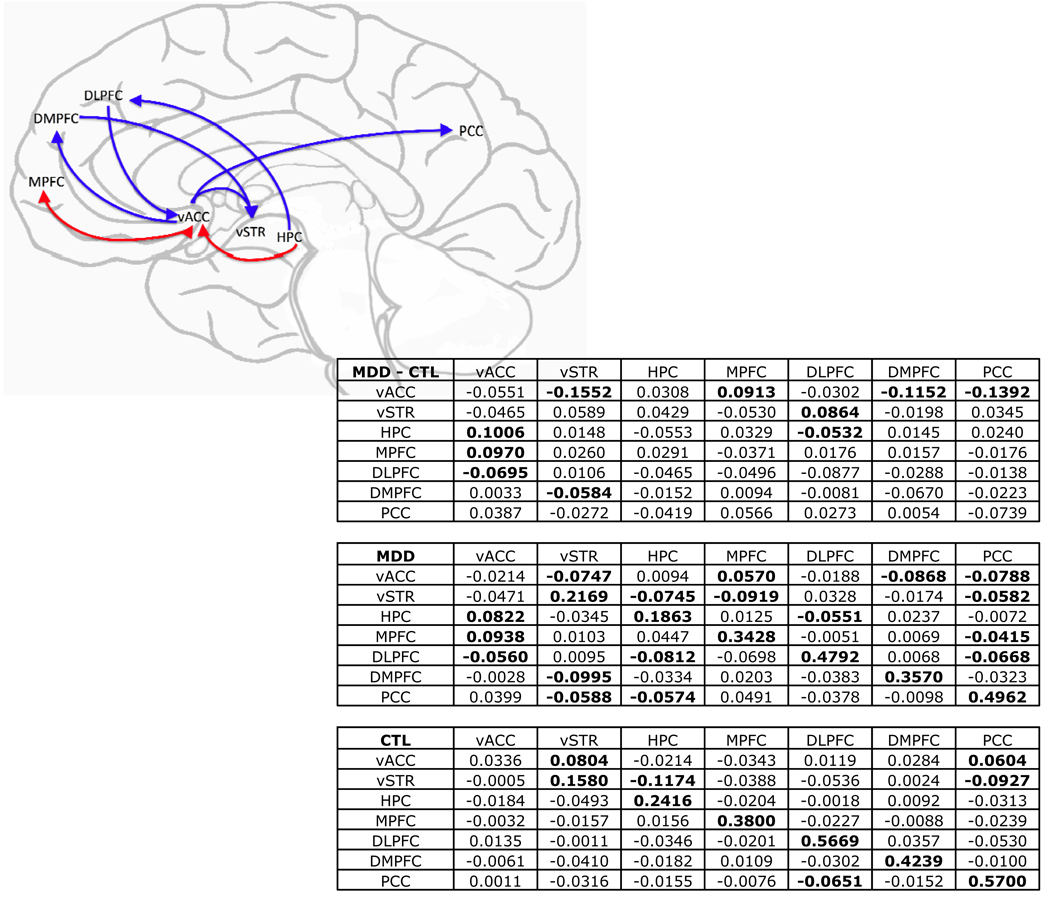
Figure 5.
Statistical map of between-groups comparison of path coefficients from multivariate GC analysis including vACC, ventral striatum (vSTR), hippocampus (HPC), MPFC, DLPFC, DMPFC, and PCC. Blue/red arrows indicate significantly greater inhibition/activation of subsequent target activity in MDD versus control where a within-group effect was also present in the MDD group (two-tailed tests, all ps < .05, uncorrected). Table values are group mean path coefficients with prediction going from row to column. Group means in bold are significantly different from zero.

