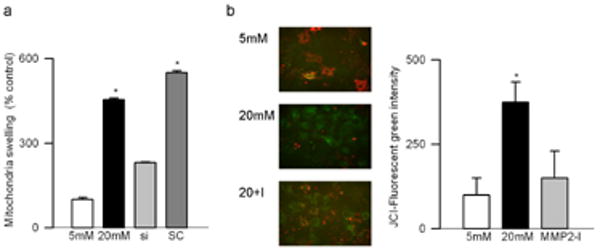
Figure 3.

Effect of MMP2 inhibition on mitochondrial membranes: (a) Freshly isolated mitochondria prepared fromMMP2-siRNA transfected or un-transfected cells incubated in 5mM or 20mM glucose for 4 days were used to determine the collapse of their membrane potential by measuring the decrease in absorbance at 540 nm induced by calcium chloride. The extent of swelling was calculated as a percentage of swelling with respect to the maximum swelling achieved by exposure to external calcium. (b) Mitochondrial membrane potential was determined by cationic dye JC-1 in the cells incubated in 5mM glucose or 20mM glucose in the presence or absence of MMP2 inhibitor (MMP2-I). Green fluorescence represents the depolarized (monomer) mitochondria and red fluorescence=hyperpolarized (J aggregates) mitochondria. Green fluorescence intensity was determined by Image J software. Results are expressed as mean ± SD, *P<0.05 compared to the values obtained from the cells incubated in 5mM glucose. 5mM and 20mM=cells incubated in 5mM glucose, or 20mM glucose respectively, si and SC= cells transfected with MMP2-siRNA or scrambled RNA respectively, followed by incubation in 20mM glucose for 4 days, and MMP2-I=cells incubated in 20mM glucose medium containing MMP2 inhibitor.
