
Figure 6.
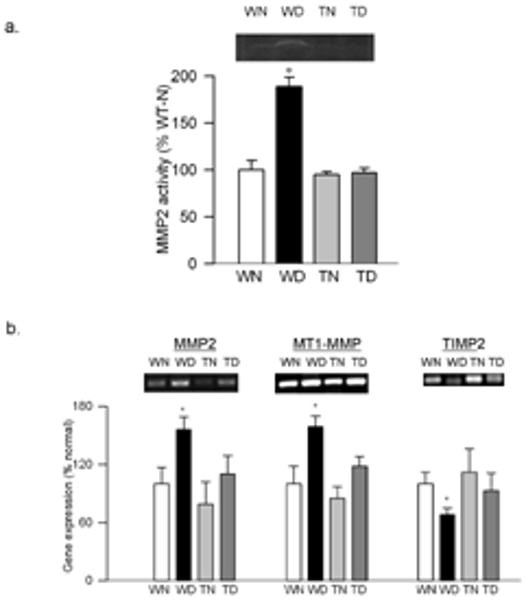
Effect of MnSOD overexpression on retinal MMP2 and its regulators: (a) The gelatinase activity of MMP2 was quantified by in-situ zymography using 10-15μg of retinal homogenate. (b) The gene expressions of MMP2, MT1-MMP and TIMP2 were quantified in the retina obtained from wild type and MnSOD over expressing mice maintained diabetic for 6 months and their age-matched controls. The levels of mRNA were adjusted to the mRNA levels of β-actin in each sample. Each measurement was done at least three times. The values obtained from WT nondiabetic mice are considered as 100%. Results are expressed as mean ± SD of at least six mice in each group. *P< 0.05 compared with WT non diabetic mice. WN and WD=wild type non diabetic and diabetic respectively, and TN and TD=MnSOD transgenic mice non diabetic and diabetic respectively.