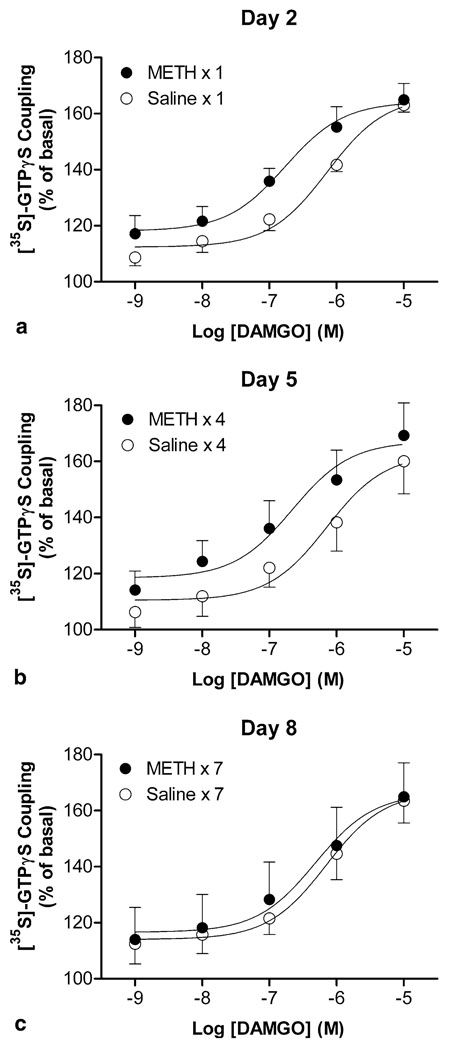
Figure 3.
Effects of METH on DAMGO-stimulated [35S]-GTPγS coupling in brain membranes during the induction period. [35S]-GTPγS coupling concentration–response curves for DAMGO were obtained in the brain from mice 24 h after the first, fourth, and last daily injections of saline or METH on days 2 (a), 5 (b), and 8 (c), respectively. Data are expressed as % of basal level (mean ± S.E.M.) under identical conditions of six independent experiments.

