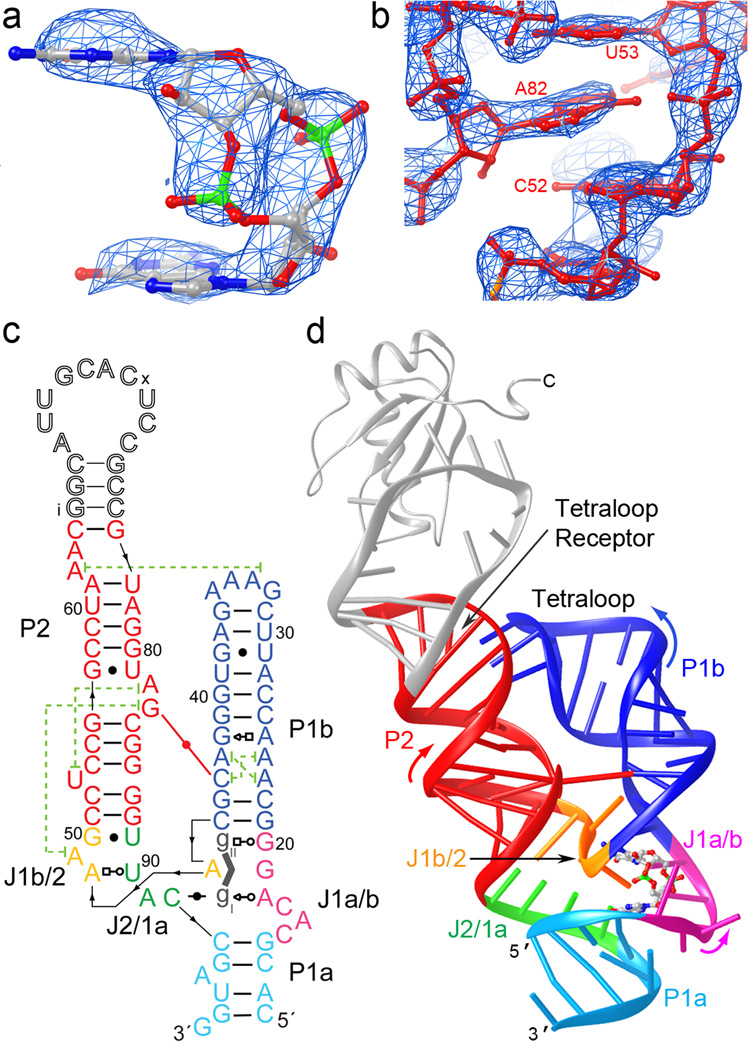
Figure 1.
Overall structure of the c-di-GMP riboswitch. (a) Unbiased |Fo|-|Fc| electron density corresponding to the bound c-di-GMP before it was included in the crystallographic model, superimposed on the refined model of the ligand (map contoured at 3.0 s.d.) (b) Portion of a composite simulated annealing-omit 2|Fo|-|Fc| Fourier synthesis42 calculated with the final crystallographic model, contoured around A82 at 1.5 s.d. (c) Schematic representation of the structure of the riboswitch bound to c-di-GMP. Thin black lines with arrowheads depict connectivity, dashed green lines, long-range stacking interactions, and the red line the inter-helical base pair. Leontis-Westhof symbols43 depict non-canonical base pairs. Except for the U1A binding site, the numbering scheme is that of ref. 6, which is used throughout. (d) Cartoon representation of the three-dimensional structure. Color coding as in (c). The U1A-RBD is shown as a gray ribbon.

