Figure 2.
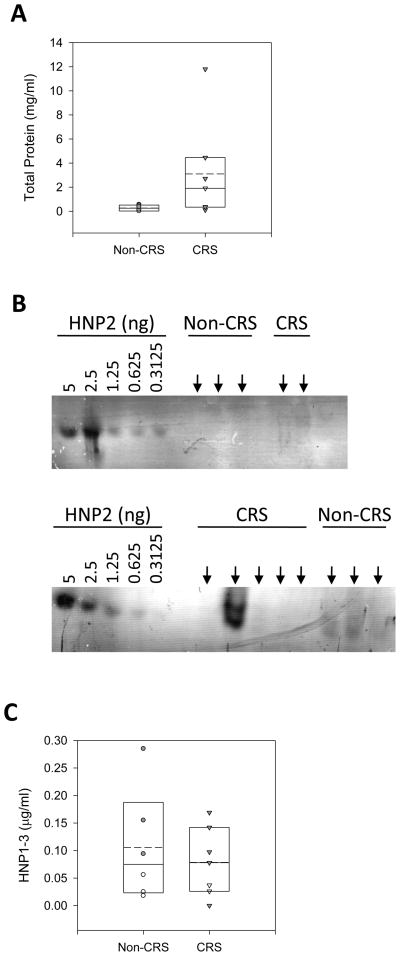
Quantification of total protein and HNP1-3 in sinus samples. (A): Total protein concentrations from nonCRS and CRS patients are depicted. Shown are individual measurements and a summary box plot. For the box plot the boundary of the box closest to and farthest from zero indicates the 25th and 95th percentile, respectively; the straight line and the dashed line within the box indicate the median and the mean, respectively. The error bar above the box indicates the 90th percentile. Whereby sinus washes tinted with blood are indicated by closed symbols. (B) Representative Western immunoblots for HNP1-3 quanitfication. Purified HNP2 standard peptide and 10 μl of each sinus sample (arrows) were subjected to AU-PAGE followed by Western immunoblotting probing for HNP1-3 with a polyclonal antibody. top: washes that appeared clear; bottom: washes that appeared tinted with blood. (C) Quantification of HNP1-3 was accomplished with VersaDoc imaging and QuantityOne software. Shown are individual HNP1-3 concentrations and a summary box plot (see panel A). For nonCRS, n = 6, and for CRS, n = 7. Sinus washes tinted with blood are indicated by closed symbols.

