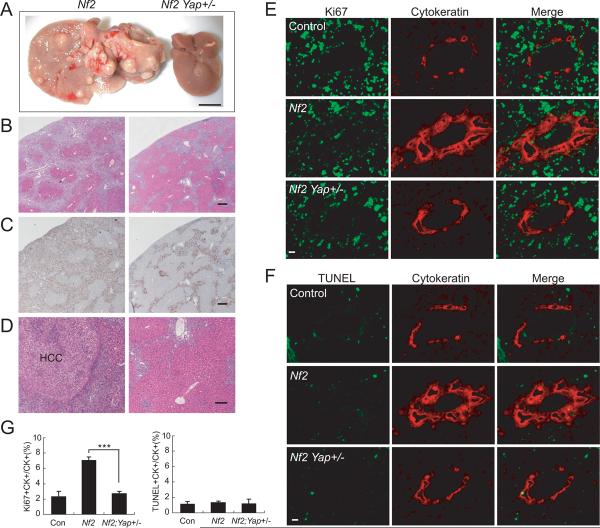
Figure 4. Heterozygosity of Yap suppresses Nf2 mutant liver phenotypes.
(A) Gross liver images from two littermates at 16 months of age. Left: Alb-Cre; Nf2flox2/flox2; Yap+/+. Right: Alb-Cre; Nf2flox2/flox2; Yapflox/+. Note the massive overgrowth and tumor formation in Nf2 mutant liver (left) and the normal appearance of Nf2, Yap+/− liver (right). Scale bar = 1 cm.
(B–C) H&E staining (B) and CK staining (C) showing the prevalence of bile duct hamartoma in Nf2 mutant livers (left) and the greatly diminished bile duct hyperplasia in Nf2 Yap+/− livers (right). Scale bars = 125 μm.
(D) H&E staining showing HCC in Nf2 mutant liver (left) and the absence of HCC in Nf2 Yap+/− liver (right). Scale bar = 60 μm.
(E) Control (top), Nf2 (middle) and Nf2 Yap+/− (bottom) livers from P0 animals were analyzed for Ki67 staining (green) and counterstained for the BEC marker cytokeratin (red). Note the abundance of Ki67-positive BECs in Nf2 livers, but not in control or Nf2 Yap+/− livers. Scale bar = 20 μm.
(F) Similar to (E) except that apoptosis was analyzed by TUNEL staining (green). Note the general absence of TUNEL-positive BECs in all genotypes.
(G) Quantification of Ki67- and TUNEL-positive BECs from (E–F). Values are means ± SEM (n = 5). ***, p < 0.001, t-test.
See Figure S4 for data supplemental to Figure 4.

