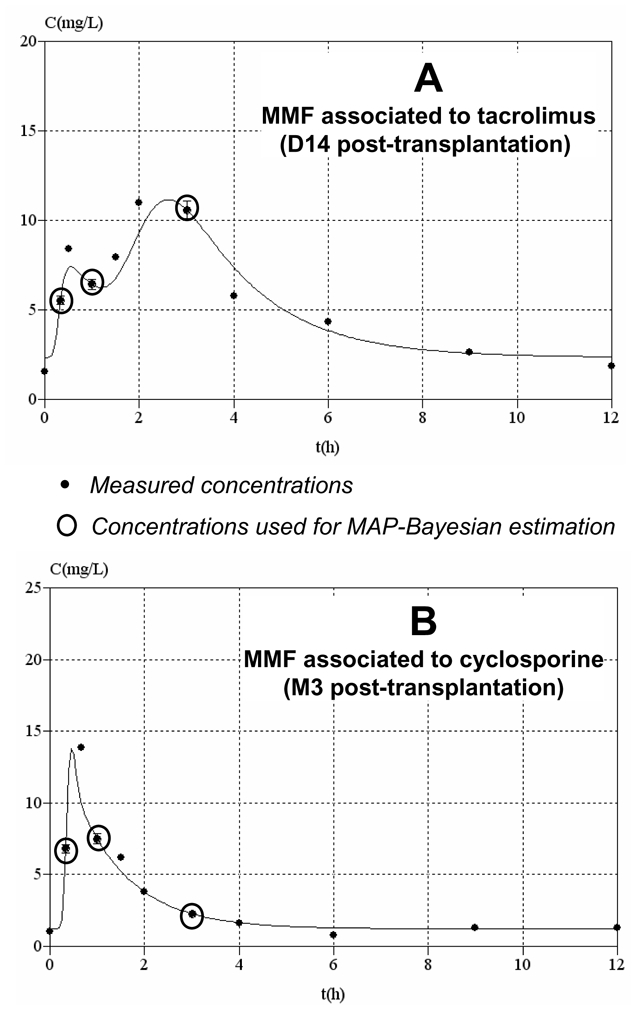
Figure 3.

Examples of concentration-time profiles of MPA measured using the enzymatic MPA assay and estimated using the Bayesian method and the 20 min-1h–3h sampling schedule. A) Profile obtained early after transplantation in a patient given tacrolimus, showing a double plasma concentration peak. B) Profile obtained in a stable patient given cyclosporine, with no second concentration peak.
