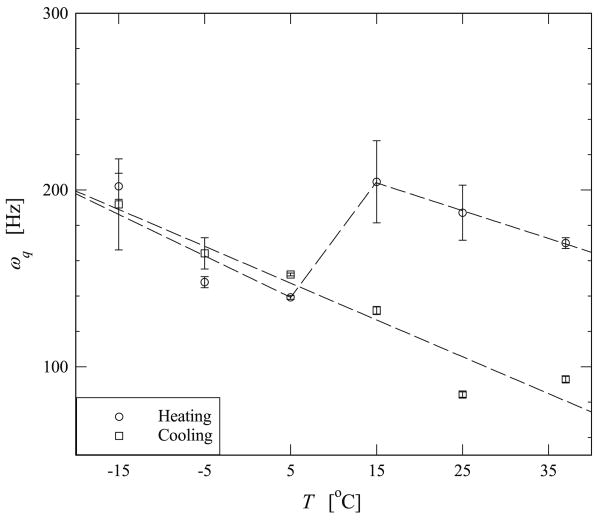
Fig. 7.
Variation of the residual quadrupolar interaction, ωq, with temperature determined by fitting Eq. (6) to the experimental data shown in Figs. 5 and 6. The graph shows the changes observed experimentally when the sample was heated from −15 °C to 37 °C and then subsequently cooled from 37 °C to −15 °C The dashed lines are intended to guide the eye and do not represent or intend to be a fit to the data.

