Figure 2.

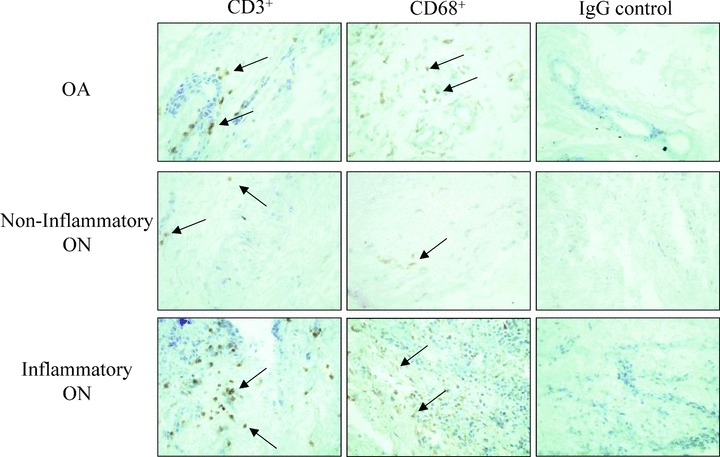
Representative photographs of CD3+ and CD68+ positive cells in OA, noninflammatory ON, and inflammatory ON ST. IgG treated controls are also shown for each group. Photographs were taken at 400×. Arrows indicate positive staining.

Representative photographs of CD3+ and CD68+ positive cells in OA, noninflammatory ON, and inflammatory ON ST. IgG treated controls are also shown for each group. Photographs were taken at 400×. Arrows indicate positive staining.