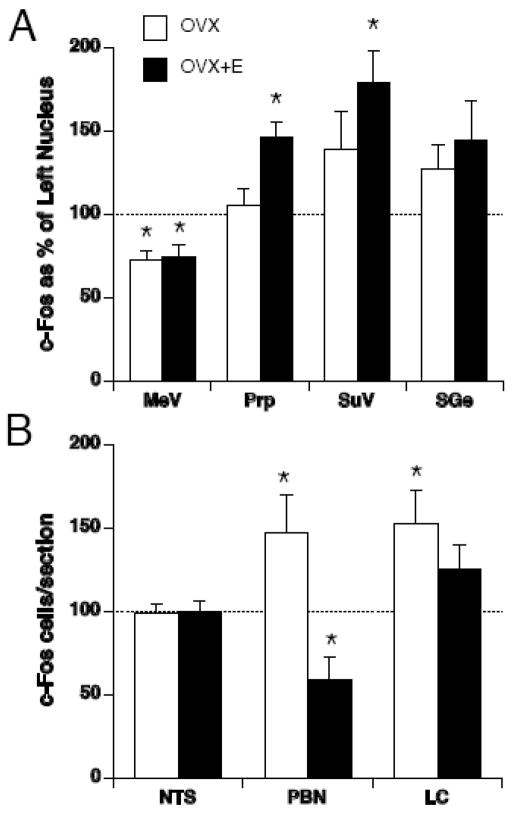
Figure 5.
Number of c-Fos positive cells after magnetic field exposure in the right side of each brain region, expressed as a percentage of c-Fos-positive cells in the left side of each brain region, for OVX (white bars) and OVX+E (black bars) rats in vestibular (A) and visceral relays (B). A significant difference from 100% indicates an asymmetrical induction of c-Fos. * p < 0.05 left v. right side, # p < 0.05 OVX vs. OVX+E.

