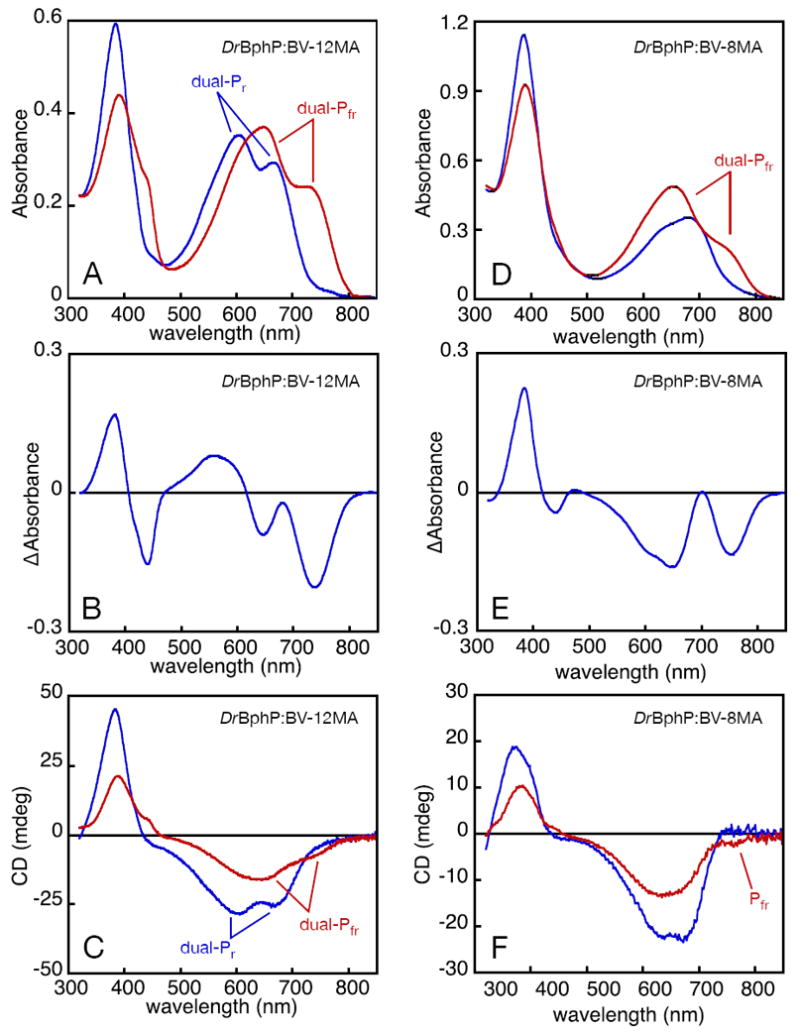
Figure 4.

Photochemistry of DrBphP assembled with bilin monoamides. DrBphP:BV-12MA (A-C) and DrBphP:BV8-MA (D-F) were characterized by absorbance and CD spectroscopy. (A) DrBphP:BV-12MA was converted from dual-Pr (blue) to dual-Pfr (red) with 600 nm light (±5 nm), giving the difference spectrum shown in (B). (C) Both dual-Pr (blue) and dual-Pfr (red) were characterized by CD spectroscopy. Inversion of CD upon photoconversion was not observed, with both dual-Pfr red-band peaks exhibiting negative CD. (D) DrBphP:BV-8MA (blue) was illuminated with 670 nm light (± 20 nm), giving enhanced red absorbance and reduced blue absorbance (red). (E) The difference spectrum is shown for the spectra presented in (D). (F) Both the DrBphP:BV-8MA dark state (blue) and photoproduct (red) were characterized by CD spectroscopy. The photoproduct region corresponding to the Pfr state of DrBphP:BV was associated with negative CD, indicating no inversion of CD occurred. The photoproduct CD peak at shorter wavelength does not match the lineshape of the corresponding absorbance peak well (compare D), and the two peak wavelengths are not in very good agreement (Supp. Table 6). Assignment of this peak is therefore uncertain, as discussed in the text.
