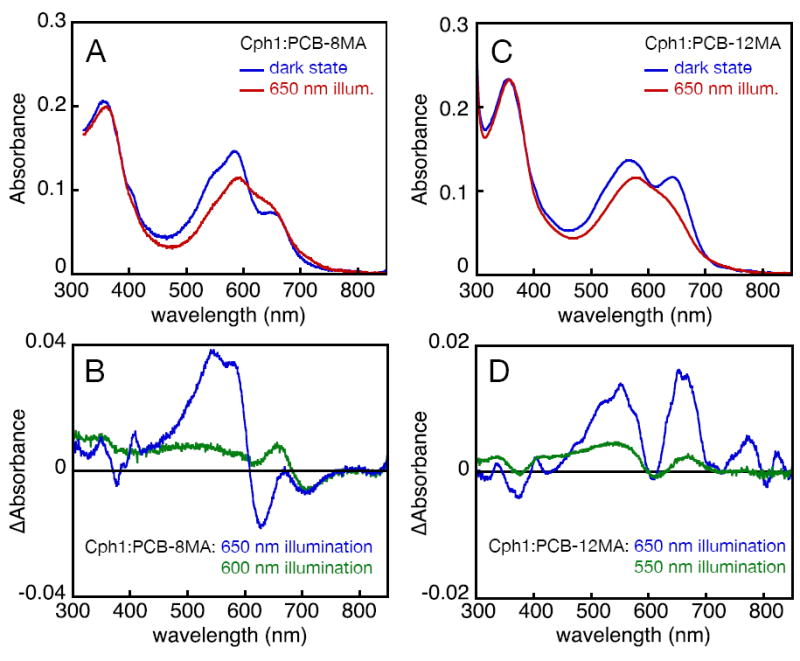
Figure 6.

Photochemistry of Cph1 assembled with PCB monoamides. (A) Cph1:PCB-8MA (blue) was illuminated with 650±20 nm light to form photoproducts (red). (B) The difference spectrum for 650±20 nm illumination (blue) revealed appearance of products at 628 and 705 nm (Supp. Table 6). The difference spectra obtained upon illumination with 600±5 nm light (green) displayed different product ratios. (C) Cph1:PCB-12MA (blue) was illuminated with 650±20 nm light to form photoproducts (red). (D) The difference spectra obtained upon illumination of Cph1:PCB-12MA with 650±20 nm light (blue) or 550±35 nm light (green) indicated the presence of comparable changes.
